
What Moves the Price of Gold?
TL;DR: Gold’s price moves on a small set of documented drivers, in order of historical weight, real interest rates, the US dollar, inflation expectations, central-bank buying, gold ETF flows, geopolitical risk, and jewelry and technology demand. The once-reliable inverse relationship between gold and real rates has weakened since 2022, as central-bank buying and geopolitical demand took on a larger role. This is an explainer on direction, not a forecast. It describes which way gold has tended to move when each driver shifts, and it does not predict, target, or quote a current spot price.
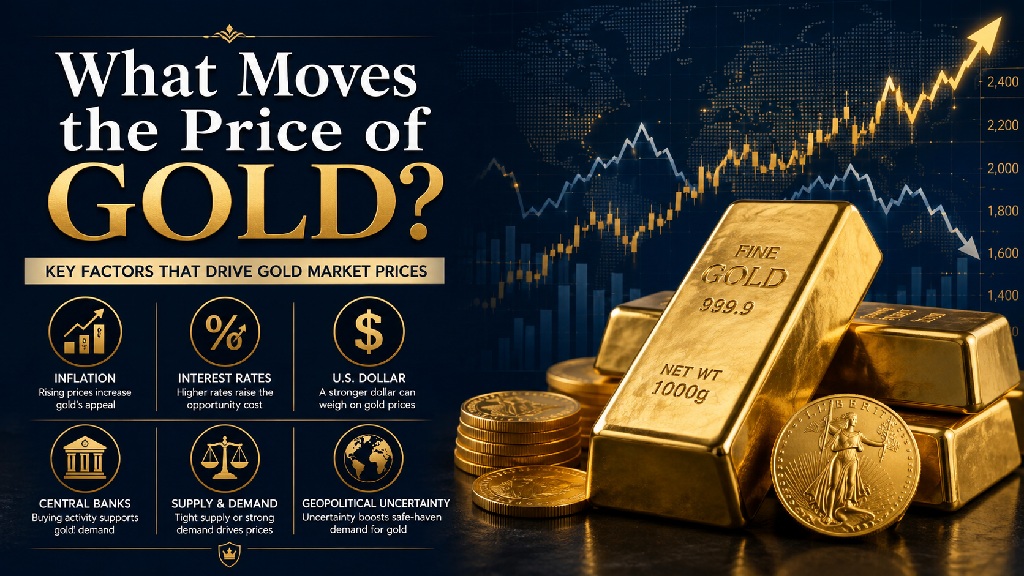
Gold can be owned in several forms, from physical bars and coins to a gold IRA to exchange-traded funds and mining shares, and the full range of routes into gold is covered on the site’s main investing-in-gold guide. What follows here is narrower, the documented forces that push and pull the price itself, drawn from data series the Federal Reserve Bank of St. Louis, the U.S. Treasury market, and the World Gold Council publish and track.
Real interest rates set gold’s baseline cost
Real interest rates, measured by the 10-year Treasury Inflation-Protected Securities yield, are the most frequently cited traditional driver of the gold price, and falling real yields have historically supported gold while rising real yields have historically weighed on it.
Gold pays no coupon or dividend, so its main competing asset is a safe bond after inflation, the real yield. FRED’s DFII10 series, maintained by the Federal Reserve Bank of St. Louis, tracks the 10-year Treasury Inflation-Protected Securities yield daily back to 2003, and it is the market’s most direct real-rate benchmark. When that yield falls or turns negative, the opportunity cost of holding a metal that pays nothing shrinks, and gold has tended to firm. When the yield rises, that cost grows, and gold has tended to soften.
Academic research backs the mechanism with a number. Erb and Harvey’s National Bureau of Economic Research working paper “The Golden Dilemma” found the correlation between 10-year TIPS real yields and the real price of gold at negative 0.82, a tight statistical link. The same paper adds a limit worth keeping. Over a longer UK sample the correlation falls to negative 0.31, meaning the relationship is regime-specific rather than a fixed law.
The regime shifted again after 2022. The World Gold Council has documented that the decade-long inverse pattern was “counterbalanced by other factors” starting that year. Real yields rose above 2 percent and gold rose alongside them, a combination the older model would not have predicted, driven instead by central-bank buying and investors hedging a wider set of risks. Real yields still matter. They no longer explain the whole tape on their own.
The dollar moves gold in the opposite direction, most of the time
Gold is priced in dollars worldwide, so a stronger dollar generally makes the same ounce more expensive for buyers holding other currencies and tends to cap demand, while a weaker dollar generally has the reverse effect and tends to support the price.
The benchmark measure is the Nominal Broad U.S. Dollar Index, tracked on FRED as DTWEXBGS, an index of the dollar’s value against a broad basket of trading-partner currencies rebased to 100 in January 2006. A real-terms companion series, RTWEXBGS, adjusts the same basket for inflation. Because gold and the dollar both function as competing stores of value for global investors, strength in one has often coincided with softness in the other. That inverse pattern is a documented tendency, not a mechanical rule, and it has weakened or flipped during episodes when investors bought both assets at once as a flight from broader risk.
Inflation expectations shift the real-yield equation from the other side
Inflation expectations, measured by the 10-year breakeven rate tracked on FRED, move gold indirectly by changing the real-yield calculation, and when expected inflation rises faster than nominal Treasury yields, the resulting drop in real yields has tended to support gold even before headline inflation data catches up.
The 10-year breakeven, tracked as T10YIE, is derived by subtracting the 10-year TIPS yield from the nominal 10-year Treasury yield. It is the market’s live estimate of expected inflation over the next decade. When breakevens climb while nominal yields sit still, real yields compress mechanically, and gold’s opportunity cost falls with them.
This is a narrower claim than “gold tracks inflation,” and the distinction matters. Gold’s short-run relationship with realized inflation is weak. It fell about 28 percent in calendar 2013, from $1,697.70 to $1,202.30 an ounce, its worst annual decline since 1981, even while the Federal Reserve was still running quantitative easing. Inflation expectations move gold through the real-yield channel described above, not through a direct link to the headline inflation print itself.
Central-bank buying has become a structural demand pillar
Central banks have bought more than 1,000 metric tons of gold in three of the past four years, a pace far above the 2010 to 2021 annual average of 473 tons, and that sustained official-sector demand has become one of the strongest structural supports under the price since 2022.
The World Gold Council’s Gold Demand Trends data put annual net central-bank purchases at 1,136 tons in 2022, a record year, 1,037 tons in 2023, 1,045 tons in 2024 (1,092.4 tons including other institutions), and 863 tons in 2025 (863.3 tons including other institutions). The 2025 figure was down 21 percent year over year but still far above the 2010 to 2021 average, and fourth-quarter 2025 net purchases rose 6 percent quarter over quarter to 230 tons.
The largest individual buyers show how broad the trend is. In 2025, the National Bank of Poland was again the largest buyer, adding 102 tons to bring its holdings to 550 tons, or 28 percent of its reserves, with a revised target of 30 percent and a stated ambition of 700 tons. The National Bank of Kazakhstan added 57 tons, its largest annual purchase on record back to 1993. The Central Bank of Brazil added 43 tons, its first purchases since 2021, and the Central Bank of Turkey added 27 tons. The Czech National Bank added 20 tons, its 34th consecutive month of buying. In 2024, the National Bank of Poland added 90 tons and the People’s Bank of China reported adding 44 tons.
The council attributes this buying to reserve diversification, de-dollarization, and a hedge against geopolitical and sanctions risk, noting that gold is the only major reserve asset free of counterparty and default risk and that it cannot be frozen by sanctions. In its 2024 survey, 95 percent of central bankers expected official gold reserves to keep rising over the following 12 months, reflecting reserve-management decisions made over years, not a signal timed to any single market move.
Total official reserves stay concentrated among a handful of governments. The United States holds the largest reserve at 8,133.5 tons, roughly 75 percent of its foreign-exchange reserves. Germany holds 3,352 tons, Italy 2,452 tons, and France 2,437 tons. Russia holds roughly 2,330 to 2,336 tons and China roughly 2,300 tons as reported.
Gold ETF flows show how investment demand adds up in real time
Gold-backed exchange-traded funds aggregate investor demand into a single visible number, and the World Gold Council’s holdings data show that number rising toward record territory through 2025, which functions as a real-time gauge of investment appetite for gold alongside the slower-moving central-bank and jewelry channels.
Global gold ETF holdings tracked by the council rose to 3,838 metric tons at the end of the third quarter of 2025, within 2 percent of the November 2020 peak of 3,929 tons, with total assets under management of $472 billion, up 23 percent quarter over quarter. The SPDR Gold Trust, the largest single gold ETF and a useful single-fund proxy for this channel, held 32,528,241.132 troy ounces as of September 30, 2025, worth $124.4 billion, up from 28,033,879.111 ounces a year earlier worth $73.7 billion, according to the fund’s SEC filing. Investors weighing an ETF against a gold mutual fund or a similar pooled vehicle are choosing between structurally similar paper-gold products, and either one adds to the same investment-demand column tracked here.
Geopolitical risk drives short-run, crisis-linked demand
Geopolitical risk moves gold on a shorter fuse than the other drivers, and the standard academic gauge, the Geopolitical Risk Index built by Federal Reserve Board economists Dario Caldara and Matteo Iacoviello, treats a reading above the 90th percentile of its historical range as the threshold for a genuine risk spike.
The Geopolitical Risk Index is built from counts of newspaper articles discussing geopolitical tensions, war, and terrorism threats. Its benchmark version, drawing on 10 newspapers, starts in 1985, and a historical extension using 3 newspapers reaches back to 1900. The World Gold Council applies the 90th-percentile threshold in its own research to flag genuine spikes rather than routine news flow. Gold has tended to catch a safe-haven bid when the index spikes, because investors reach for an asset with no counterparty and no dependence on any single government’s credit. The direction of that response is well documented. The size and duration of any single spike are not predictable from the index alone.
Jewelry and technology demand add a slower-moving floor under the price
Jewelry and technology consumption form the largest physical-demand channel gold has, and in full-year 2024 that channel behaved exactly as economic theory predicts when prices climb, with the volume of gold bought for jewelry falling even as the dollar amount spent on it rose.
Gold Demand Trends data show jewelry consumption at 1,877 tons in 2024, down 11 percent year over year as high prices dampened the volume buyers could afford, even though spending rose 9 percent to $144 billion. Technology demand grew 7 percent, adding 21 tons, a gain the council attributes to AI-related hardware adoption. Total gold demand, including over-the-counter activity, reached a record 4,974 tons worth $382 billion for the year. Jewelry demand is also the driver most sensitive to household income growth in India and China, the two largest jewelry-consuming markets, which makes it move on an income cycle rather than a market-news cycle.
No single driver explains a given day’s move in the gold price. Real yields, the dollar, and inflation expectations set the financial-market baseline. Central-bank buying and ETF flows add or subtract structural and investment demand on top of that baseline. Geopolitical risk and jewelry and technology demand add shorter-run and slower-moving physical-market pressure. The World Gold Council’s own assessment, cited above, is that no single indicator has been sufficient since 2022. An investor trying to understand a move in the price is better served by checking several of these series than by trusting a headline that credits just one of them. For guidance on sizing and structuring an actual position, see the site’s gold investment strategies guide.
Frequently Asked Questions
These are the most common follow-up questions about what moves the price of gold, answered directly from the same primary data series covered in the sections above, without adding any new figures beyond what those sections already establish.
What is the single most important driver of the gold price?
Historically, real interest rates showed the tightest statistical relationship, with academic research placing the correlation between 10-year TIPS yields and the real gold price at negative 0.82. Since 2022, the World Gold Council has found that relationship “counterbalanced by other factors,” with central-bank buying and geopolitical risk playing a larger role, so no single indicator has been sufficient on its own.
Does central-bank gold buying mean a crisis is coming?
Not on its own. Central banks add gold to diversify reserves and reduce dependence on currency assets that can be frozen by sanctions, and the World Gold Council frames this buying as strategic reserve management rather than a crisis signal. In the council’s 2024 survey, 95 percent of central bankers expected official reserves to keep rising over the following year, consistent with an ongoing diversification trend rather than a single forecast.
If the dollar weakens, will gold definitely rise?
Not automatically. Gold and the dollar have moved in opposite directions often enough that the relationship is a documented tendency, but it is not mechanical, and both assets have risen together during episodes when investors sought safety from broader risk rather than currency exposure specifically.
Is gold a reliable hedge against this month’s inflation report?
The data does not support that. Gold fell about 28 percent in 2013 even while the Federal Reserve was running quantitative easing, evidence that short-run inflation prints do not move gold in a predictable way. Inflation affects gold mainly through the real-yield channel described above, and over a longer horizon than a single reading.
This article explains the documented historical drivers of the gold price for educational purposes. It is not investment advice, a price forecast, or a recommendation to buy or sell gold, and it does not state a current spot price. Always weigh these drivers against your own plan, and consult your own financial and tax professionals before acting on them.