
Gold vs Stocks: Gold’s Role in a Portfolio
TL;DR: Gold versus stocks is not an either-or decision. Over multi-decade horizons, equities have delivered higher total returns once dividends are reinvested, because gold pays no yield. What gold offers instead is a near-zero long-run correlation to stocks, which has made it a diversifier that has cushioned some equity drawdowns rather than a substitute for stock ownership. The two roles are different, and a portfolio can use both.
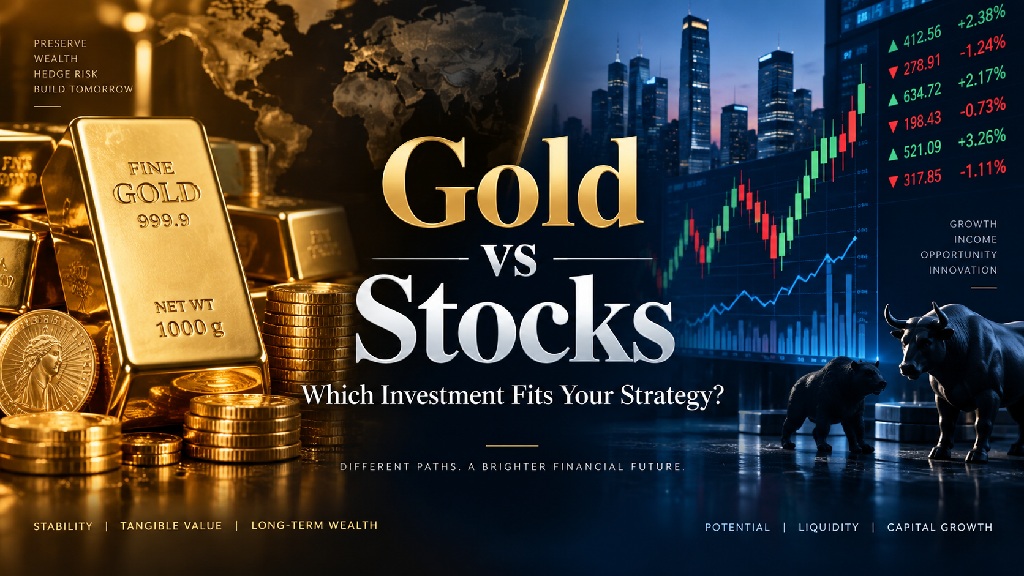
Gold and Stocks Have Delivered Roughly Similar Price Returns Since 1971
On a price-only basis, gold and the S&P 500 have moved together more closely over the long run than most investors assume.
The comparison starts on August 15, 1971, when President Nixon closed the gold window and ended the dollar’s fixed convertibility into gold at $35 an ounce. From that date through 2019, one widely cited chart from the financial data site TopForeignStocks put gold’s annualized return at roughly 7.8 percent, against a price return for the S&P 500, excluding dividends, of roughly 7.3 percent. Those specific figures come from a secondary analysis rather than a primary index provider, so they should be read as a rough approximation of the shape of the comparison rather than a precise, audited number. The headline point that does hold up is more modest: measured purely on price, without dividends, gold and the S&P 500 have covered similar ground since the early 1970s.
Once Dividends Are Reinvested, Stocks Pull Ahead
The price-only comparison hides the one detail that decides most long-horizon portfolios: stocks pay dividends, and gold does not.
A fair comparison has to use the S&P 500’s total return, which assumes dividends are reinvested, rather than its price index alone. One estimate from the metals-industry site Minted Metal puts the S&P 500’s total-return compound annual growth rate since 1971 at roughly 11 percent, about two percentage points a year above the price-only figure. That number is also secondary and should be treated as directional rather than exact. A separate, more recent data point is on firmer footing: financial publisher Kiplinger reports the S&P 500 delivered approximately 11.1 percent annualized total return before inflation over 1995 to 2025, or about 8.4 percent after inflation. Compounded over multiple decades, a two-point annual dividend advantage is not trivial. It is the mathematical reason gold, held on its own, has historically lagged a total-return stock index over long bull-market stretches. Gold produces no coupon, no dividend, and no rental income, and physical holdings carry storage and insurance costs on top of that, a negative carry that a dividend-paying stock does not have.
Volatility Has Been Comparable, Not Dramatically Different
Gold has a reputation for being the more volatile of the two assets, and the data does not fully support that reputation.
Research from State Street Global Advisors, covering the 30-year period from August 1987 through September 2019, found gold’s annualized volatility at 15.44 percent against 14.32 percent for the S&P 500. The gap is real but small, roughly one percentage point, and it undercuts the common assumption that gold swings far more wildly than the broad stock market over long stretches. Shorter windows can look different in either direction, but over three decades the two assets have moved with roughly similar intensity even though they move for different reasons.
Gold’s Near-Zero Correlation to Stocks Is the Real Investment Case
The strongest argument for owning some gold alongside stocks is not return, it is correlation.
Correlation measures how closely two assets move together, on a scale from minus 1 (moving in exact opposite directions) to plus 1 (moving in perfect lockstep). A figure of roughly 0.06 for the 30-year gold to S&P 500 correlation has been cited, tracing back to World Gold Council research reported through the data site Volity. That specific coefficient has not been independently confirmed against a primary World Gold Council file, so it should be read as an approximation. What is confirmed directly by the World Gold Council’s own diversification research is the underlying characterization: gold’s long-run correlation to equities sits near zero. A near-zero correlation means gold’s price moves are, on average, mostly unrelated to what stocks are doing on a given day. That is the mechanical basis for pairing the two. Combining two assets that do not move together, rather than one asset that simply performs well, is what smooths a portfolio’s overall path.
Gold Has Cushioned Some of the Worst Stock Market Drawdowns
Gold’s diversification value shows up most clearly in the periods stocks investors want to forget.
In 2008, during the global financial crisis, gold ended the year positive in dollar terms, with a World Gold Trust Services filing to the Securities and Exchange Commission describing the year’s gold rise as capped near 6 percent, while the S&P 500’s total return that year was negative 37.00 percent, per data compiled by Slickcharts. The World Gold Council also notes gold rose roughly 21 percent in dollar terms from December 2007 through February 2009, spanning the worst of the crash. That does not mean gold is immune to selling pressure when markets panic. The metal briefly fell alongside stocks in both the initial October 2008 liquidation and the March 2020 COVID crash, as investors sold whatever was liquid to raise cash, before recovering in the following weeks and months. The World Gold Council’s own research describes gold’s correlation to equities as falling, and turning negative, during stock sell-offs, while it can rise again once equities rally, which is a more nuanced pattern than a simple, permanent hedge. For a closer look at how gold behaves specifically as a crisis asset, see the site’s safe-haven breakdown.
The Practical Verdict Is Not Either-Or
Gold and stocks answer different questions, which is why the useful framing is “and,” not “or.”
Stocks are the growth engine of a portfolio, compounding through earnings, dividends, and reinvestment over time. Gold is a diversifier with no yield of its own, valuable mainly because its price does not track the same drivers as corporate earnings and interest-rate-sensitive equity valuations. For a broader look at all the ways to build gold exposure, including IRAs, ETFs, mining shares, and physical bullion, see the main investing-in-gold overview. Investors weighing the physical-versus-paper question specifically, allocated bars and coins against an ETF share or a brokerage-held fund, can find that comparison laid out in detail on the site’s physical gold versus paper gold page.
How Much Gold Belongs in a Portfolio
The right allocation size is a separate question from the one this page answers, and it has its own dedicated breakdown.
For context, the World Gold Council’s own optimal-allocation research has generally found a range of about 2 percent to 10 percent improves risk-adjusted returns across currencies and scenarios, with its most recent study using data from January 2000 through May 2025 pointing toward roughly 5 percent to 8 percent. Those figures come from an industry research body funded by gold-mining interests, which does not make them wrong, but it is worth reading allocation research from a metals-focused organization with that context in mind. The right number for an individual portfolio depends on time horizon, risk tolerance, and what else is already held. The site’s portfolio-allocation page works through that decision in full.
Frequently Asked Questions
Is gold a better long-term investment than stocks?
Not on a total-return basis. Once stock dividends are reinvested, equities have historically pulled ahead of gold’s price-only return over multi-decade horizons, because gold generates no income of its own. Gold’s advantage has concentrated in specific regimes, such as the high-inflation 1970s and acute financial crises, rather than across a typical multi-decade bull market.
Why does gold have a low correlation with the stock market?
Gold’s price is driven mainly by real interest rates, the US dollar, central-bank buying, and physical demand, which are different forces than the earnings growth and interest-rate sensitivity that drive equity valuations. Because the two assets respond to different inputs, their prices have historically moved largely independently of each other over the long run, which is what shows up statistically as a near-zero correlation.
Does gold protect a portfolio during a stock market crash?
Gold’s record here is conditional rather than absolute. It held up well through the 2008 financial crisis, ending the year positive while the S&P 500’s total return was sharply negative, but it briefly sold off alongside stocks in the initial panic of both the 2008 crisis and the March 2020 COVID crash before recovering. Its safe-haven behavior tends to be strongest in downturns driven by macroeconomic or systemic stress, and weaker in the first weeks of a pure liquidity scramble.
How much of my portfolio should be in gold?
That depends on individual time horizon, risk tolerance, and the rest of a portfolio’s composition, so this page does not attempt to give a single number. The site’s dedicated allocation breakdown walks through the research and the trade-offs behind common allocation ranges.
Educational content only. This article does not constitute investment, tax, or legal advice, and it is not a recommendation to buy, sell, or hold gold or any security at any particular time or price. Always weigh this against your own plan, and consult your own financial and tax professionals before acting on it.