
Gold vs Silver: Which Should You Invest In?
TL;DR: Neither metal is universally better. Silver trades at a small fraction of gold’s price per ounce and draws more than half its demand from factories and manufacturers, which makes it the more volatile of the two, with sharper upside and sharper downside in a given cycle. Gold behaves more like a monetary reserve asset, anchored by sustained central-bank buying and safe-haven demand, which makes it the steadier holding. The right mix depends on whether an investor wants a stabilizer or a higher-beta bet tied to industrial growth, not on picking a single winner.
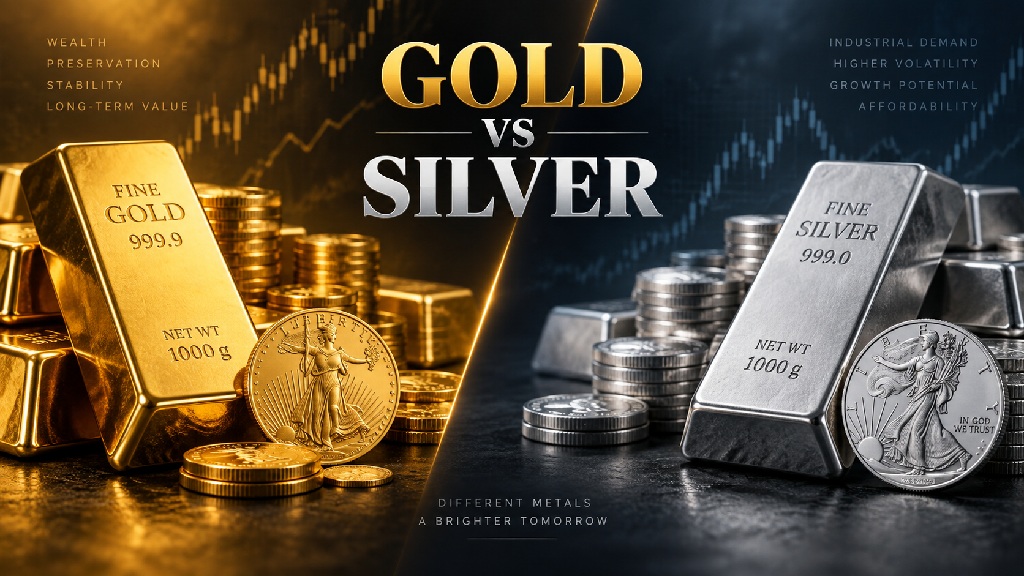
Neither Metal Is Universally Better
Gold and silver serve different roles in a portfolio, and the metal that fits an investor best depends on what that investor is trying to accomplish, not on which metal is objectively superior.
Silver is the cheaper, higher-volatility metal with a real foothold in industrial production. Gold is the steadier, more monetary metal that central banks hold as a reserve asset with no counterparty risk. Both track the same broad direction over long stretches, since both are priced in dollars and both respond to some of the same macro forces, but they respond with different intensity and for partly different reasons.
The clearest way to see the gap between them is the gold-silver ratio, a single number that compares how much silver it takes to buy an ounce of gold. The sections below work through that ratio, the industrial-demand split that drives silver’s extra volatility, and the central-bank demand that gives gold its steadier, more monetary character. Investors weighing a full range of ways into gold, including physical bullion, IRAs, and paper exposure, can see the complete overview on the investingingold.com homepage.
The Gold-Silver Ratio: What It Measures and Where It Stands
The gold-silver ratio, which measures how many ounces of silver it takes to buy one ounce of gold, is the standard way to compare the two metals, and it moves far more than either metal’s price alone would suggest.
Industry reference sources that track the ratio against the LBMA benchmark prices put the long-run average since roughly 1900 at somewhere near 55 to 65 ounces of silver per ounce of gold, with the annual-average series centering close to 60. The ratio does not sit still. It spiked to a record above 100 to 1, reported at roughly 124 to 125 to 1, in March 2020, when the COVID panic drove investors into gold as a safe haven while industrial silver demand collapsed almost overnight. It fell the other direction to roughly 17 to 1 in January 1980, near the peak of the Hunt brothers’ attempted silver corner. Further back, the U.S. Coinage Act of 1792 fixed the ratio by law at 15 to 1, a reminder that the relationship between the two metals used to be a matter of statute rather than a market outcome.
A wide, swinging ratio is itself the lesson. When the ratio is historically high, silver is cheap relative to gold by that measure. When it is historically low, gold is cheap relative to silver. Neither extreme is a signal to trade on by itself, since the ratio can stay stretched for years, but the range shows how much more the relationship between the two metals moves than most investors expect going in.
Why Silver Moves More Than Gold
Silver’s price swings harder than gold’s because more than half of silver demand comes from industrial buyers, which ties the metal to factory orders and manufacturing cycles rather than to the reserve and safe-haven flows that anchor gold.
The World Gold Council frames the contrast directly, describing silver as behaving “more like a cyclical asset” in risk-off periods and noting that it “does not consistently provide the same protection” gold does, which limits its stabilizing role in a portfolio.
The Silver Institute, the primary industry data source for the metal, reported that industrial demand for silver reached a record 680.5 million ounces in 2024, up 4 percent and the fourth consecutive record year, driven in large part by electronics and solar-panel manufacturing. Total silver demand that year was 1.16 billion ounces, which puts industrial use at roughly 59 percent of the total. Total demand ran ahead of new mine and recycled supply for a fifth straight year, a structural deficit of 148.9 million ounces in 2024 alone.
Gold’s technology and industrial use is a rounding error by comparison. In the same year, technology demand for gold, driven partly by AI-related electronics, added only about 21 tonnes to gold demand, against 1,877 tonnes of jewellery demand and thousands of tonnes of investment and central-bank demand. Silver’s industrial exposure gives it real upside when manufacturing and electronics demand runs hot, and it is also the reason silver tends to fall harder than gold when factory orders slow, since a much larger share of the metal that gets bought each year is bought to be used, not held.
Why Gold Behaves Like a Monetary Asset
Gold trades more like a reserve currency than an industrial commodity because central banks have been large, sustained buyers of it for years, and that demand pillar has held up even as other drivers of the gold price have shifted.
Central banks bought 1,136 tonnes in 2022, a record year, then 1,037 tonnes in 2023 and 1,045 tonnes in 2024, before easing to 863 tonnes in 2025. Every one of those years came in far above the 473-tonne average central banks bought annually between 2010 and 2021, according to the World Gold Council’s Gold Demand Trends data. That buying reflects reserve diversification and a hedge against currency and political concentration risk rather than a forecast about where the price goes next, and it is a demand source silver simply does not have at comparable scale.
Gold’s price also answers to real interest rates, since the metal pays no coupon and its main competition is the inflation-adjusted return on safe bonds tracked by the 10-year Treasury Inflation-Protected Securities yield. That relationship weakened after 2022, with gold rising even as real yields climbed, a shift both the World Gold Council and independent research attribute to central-bank buying and geopolitical demand taking over as bigger drivers. Gold’s safe-haven behavior showed up clearly in the 2008 financial crisis, when gold finished the year positive while the S&P 500’s total return was roughly negative 37 percent, though the metal is not immune to short liquidity-driven sell-offs at the very start of a crisis, as it also briefly showed in March 2020. Over long stretches, gold’s correlation to stocks runs close to zero, which is the core of its diversification case and a behavior silver, with its industrial ties to the broader economy, does not replicate to the same degree.
How Much of Each Belongs in a Portfolio
There is no single correct split between gold and silver, but the research on gold specifically points to a modest allocation rather than a large one, and silver’s extra volatility argues for treating it as the smaller, higher-beta piece of that allocation.
World Gold Council research on optimal gold allocation generally finds a range of 2 to 10 percent improves risk-adjusted portfolio returns, with its most recent study using data from January 2000 through May 2025 narrowing that to roughly 5 to 8 percent. The rationale is gold’s near-zero long-run correlation to stocks and bonds, which shifts the efficient frontier of a portfolio even though gold itself produces no yield and carries real storage and insurance costs.
Silver is not covered by the same allocation research, and this pack does not support attaching a specific percentage figure to it. What the industrial-demand data does support is a qualitative point. Because silver’s price is more exposed to the same manufacturing cycle that already moves an investor’s stocks and industrial exposure, a silver position adds less true diversification than a gold position of the same size, even though it can also add more upside in a strong industrial cycle. Investors who want both metals typically size silver as a smaller slice of a broader gold-anchored precious-metals allocation for that reason. Always weigh any allocation against your own plan, time horizon, and risk tolerance, and consult your own financial and tax professionals before acting on it.
Gold and Silver Inside a Retirement Account
Both metals can sit inside a self-directed IRA, but only specific coins and bars that meet a minimum fineness standard qualify, and the metal has to be held by an approved custodian and depository rather than at home.
That IRS purity rule applies to gold, silver, platinum, and palladium alike under the tax code governing IRA-eligible precious metals, and it is the reason product selection inside an IRA looks different from buying bullion in a taxable account. The mechanics of setting up and funding a gold IRA, including custodian and depository requirements, are covered in the site’s dedicated gold IRA guide. Investors specifically weighing which silver coins and bars clear the IRA fineness bar should see the guide to IRA-eligible silver coins, which covers product selection in more detail than fits here.
The core trade-off inside a retirement account mirrors the trade-off outside one. Gold tends to anchor an IRA’s precious-metals sleeve with steadier, more monetary behavior, while a smaller silver allocation adds industrial-cycle exposure and a lower entry price per ounce. Neither choice is dictated by the tax wrapper itself, since the fineness rule applies equally to both metals. It comes down to the same portfolio-role question an investor would ask outside an IRA, just applied to a smaller, more tightly regulated menu of eligible products.
Frequently Asked Questions
What is the gold-silver ratio and why does it matter? It is the number of ounces of silver needed to buy one ounce of gold. Industry reference sources put the long-run average since around 1900 near 55 to 65 to 1, though the ratio has swung from roughly 15 to 1 in the 18th century to above 100 to 1 during the March 2020 panic. A wide swing shows how differently the two metals can trade relative to each other, not a signal to time a trade around.
Is silver more volatile than gold? Yes, historically. More than half of silver’s annual demand comes from industrial buyers, according to the Silver Institute, which ties its price to manufacturing cycles that gold, with its much smaller industrial footprint, is largely insulated from. That industrial tie cuts both ways, adding upside in strong cycles and extra downside in weak ones.
Should an investor own gold, silver, or both? That depends on the goal. An investor looking for a steadier diversifier with a demonstrated near-zero long-run correlation to stocks has more research support for a modest gold allocation specifically. An investor comfortable with more volatility in exchange for lower entry cost and industrial-demand upside may add a smaller silver position alongside it. Neither this article nor the broader research base makes a case for one metal at the total exclusion of the other.
Can gold and silver both be held in a retirement account? Yes, subject to the same IRS fineness rule for IRA-eligible precious metals, held with an approved custodian and depository. The specific coins and bars that qualify differ by metal, which is why product selection is usually handled separately for each.
This article is educational information about gold and silver as asset classes. It is not investment, legal, or tax advice, and it does not recommend buying or selling either metal at any particular time or price. Always consult your own financial and tax professionals before acting on anything here.